HKTDC Export Index 3Q23: Export Sentiment Softens from Two-year High
The HKTDC Export Index fell to 40.5 in the third quarter of 2023 (3Q23), after a surge to a two-year high of 47.8 in the previous quarter. While export confidence softened across all sectors, the toy and electronics sectors fared better, sub-indices of 42.2 and 40.8 respectively.
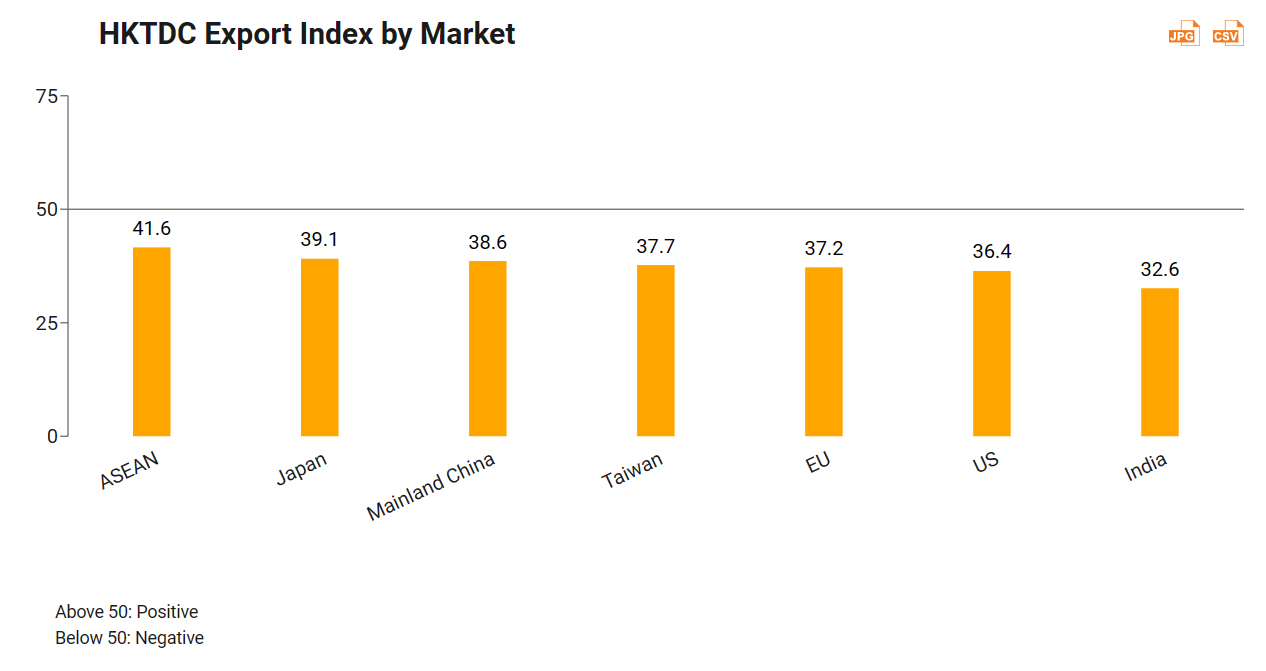
Relatively speaking, Hong Kong exporters are more optimistic about the Asian market. ASEAN performed best with a sub-index of 41.6, followed by Japan (39.1) and mainland China (38.6).
The Trade Value Index decreased by 4.8 points to 44.0, indicating downward price pressure in the coming months.
Hong Kong exporters tended to run down on inventory. The overall Inventory Index was 51.5 in 3Q23 (suggesting exporters are holding slightly lower than normal inventory) versus 48.5 (indicating higher-than-normal inventory) in 2Q23.
New orders activity remains weak. While the Current New Orders Index weakened significantly, by 12.5 points, to 32.6 in 3Q23, the Expected New Orders Index fell into contractionary territory, standing at 46.2.
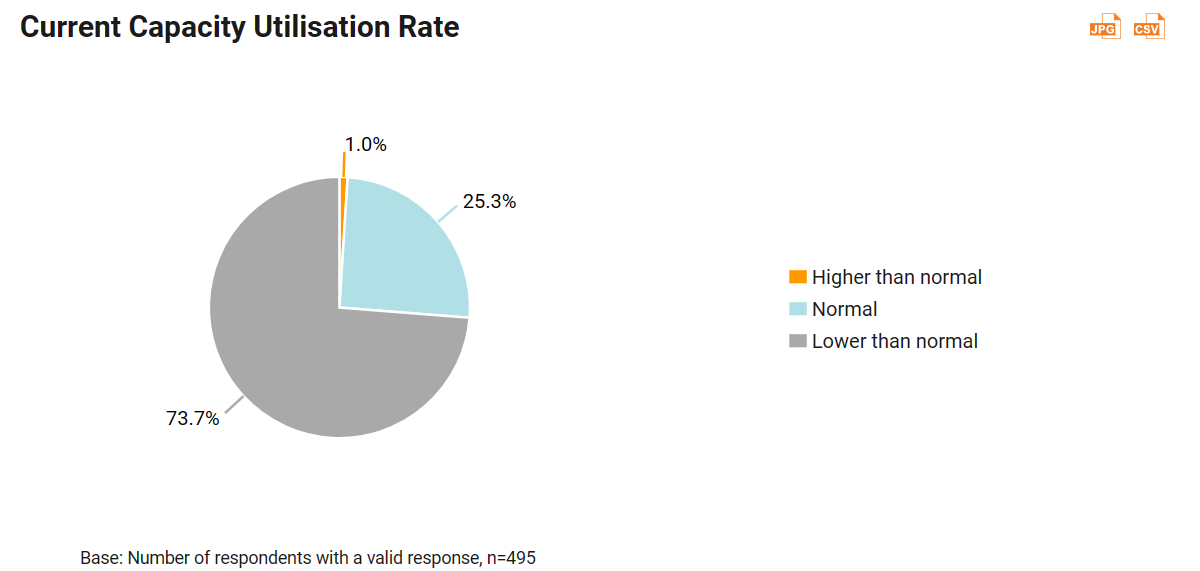
More than 70% of the respondents said they are currently operating at less than normal capacity. That may explain why procurement and employment activity remains subdued.
Economic risks remain the top concern. Almost half of respondents (48.6%) saw economic slowdowns or recession risks in overseas markets as the biggest challenge, followed by rising geopolitical tensions (17.9%) and a lower-than-expected boost from the mainland’s economic recovery (16.5%).
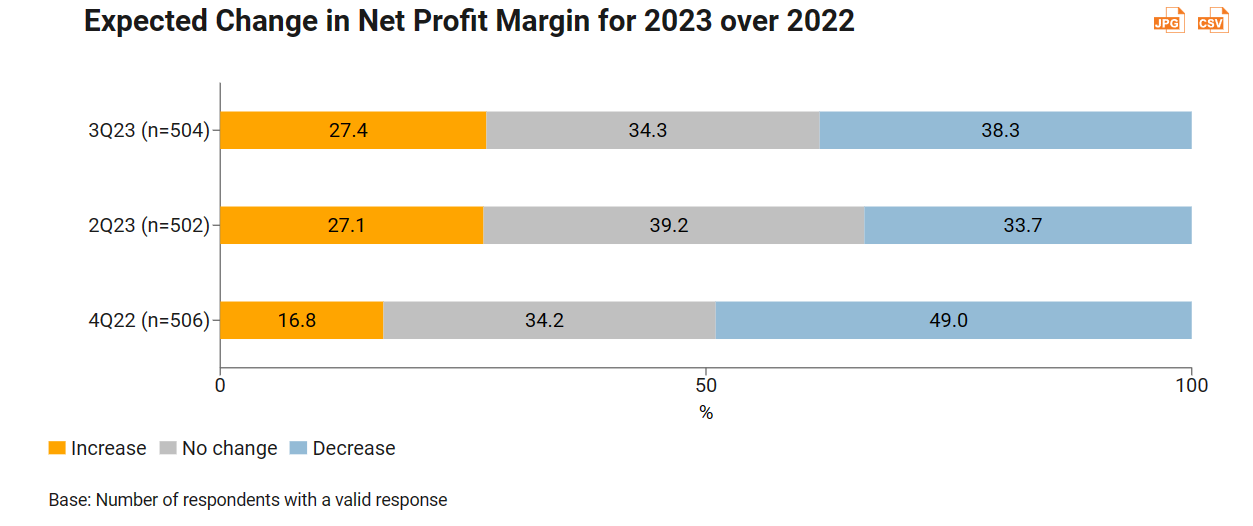
Exporters’ views on the profitability outlook for their operations remain the same. The majority of respondents (61.7%) expected to see stable (34.3%) or higher (27.4%) profit margins.
Exporters tend to adopt pro-growth business strategies. Increasing their marketing and promotional activities, providing a wider range of value-added services, diversifying sales to additional markets and increasing their use of e-commerce are among the top five business strategies identified, albeit cash-flow management remains a key focus.
The HKTDC Export Index dropped by 7.3 points to 40.5 in 3Q23, after reaching a two‑year high of 47.8 in 2Q23, due mainly to weakening global demand and continued geopolitical tensions.
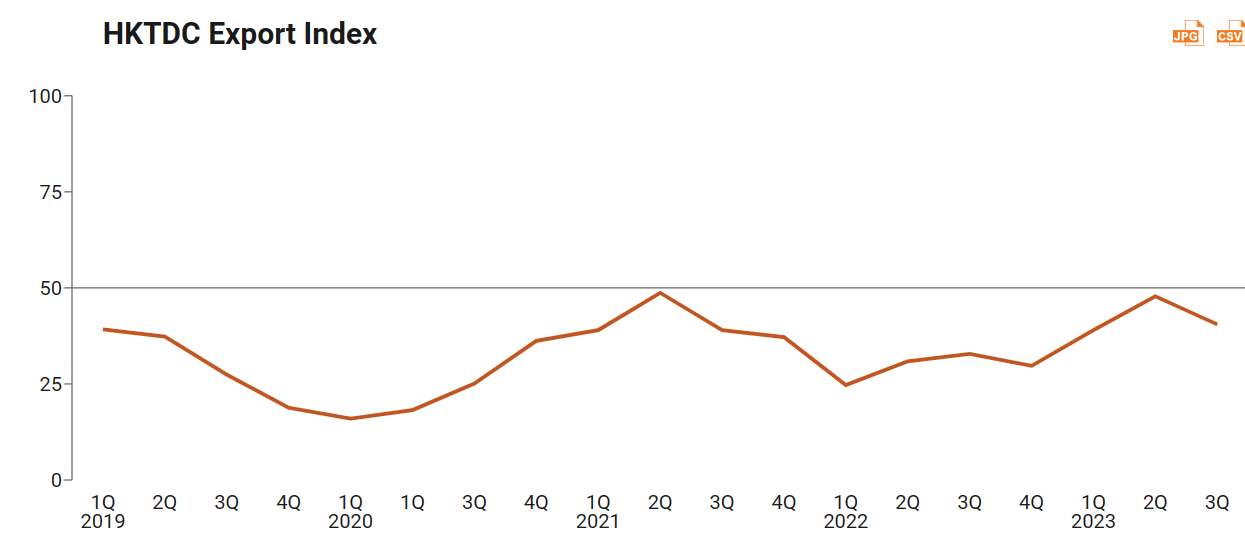
Exporters in all the major sectors became more cautious in 3Q23. Toys at 42.2 (down by 13.2 points) and electronics at 40.8 (down by 6.9 points) were seen as the better performing sectors, while timepieces saw the most substantial drop, falling by 15.9 points to 32.9.
Period | HKTDC | Electronics | Clothing | Toys | Jewellery | Timepieces | Machinery |
3Q23 | 40.5 | 40.8 | 36.9 | 42.2 | 36.1 | 32.9 | 39.4 |
2Q23 | 47.8 | 47.7 | 43.9 | 55.4 | 47.1 | 48.8 | 50.3 |
1Q23 | 39.0 | 38.2 | 51.5 | 47.9 | 43.3 | 47.5 | 42.9 |
4Q22 | 29.7 | 29.5 | 23.8 | 28.9 | 30.8 | 36.8 | 38.3 |
Two new markets (India and Taiwan) were added to provide insights on additional markets in 3Q23, with the seven major export markets covered in this study capturing around 85% of HK’s total exports (in value terms). The sentiment towards all key export markets was below 50, with sentiment towards ASEAN (41.6) being the most positive, followed by Japan (39.1) and mainland China (38.6).
New orders activity remains weak. The Current New Orders Index fell further into contractionary territory, with the overall volume of new export orders down 12.5 points to 32.6 for 3Q23. However, exporters are more positive about new export orders for 4Q23, resulting in an overall Expected New Orders Index of 46.2.
Index | 3Q23 | 2Q23 |
Current New Orders Index | 32.6 | 45.1 |
Expected New Orders Index | 46.2 | 53.6 |
Note: The New Orders Index, first introduced in the HKTDC Export Index 2Q23 survey, tracks the level of new export orders received by respondents in volume terms for the present quarter (“current”) and upcoming quarter (“expected”). The index takes values between 0 and 100. An index reading above 50 indicates an upward trend and an optimistic outlook, while a reading below 50 indicates a downward trend and a pessimistic outlook. | ||
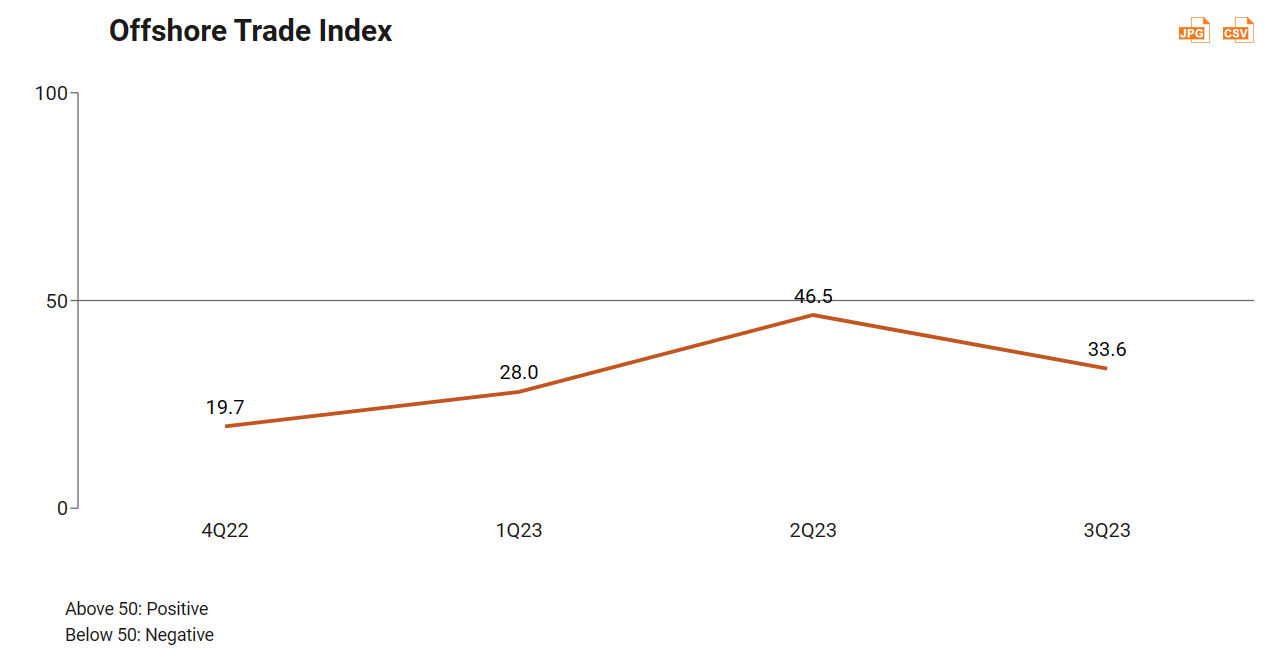
The Offshore Trade Index, which tracks sentiment related to shipments not passing through Hong Kong but managed by businesses within the city, also recorded a sharp decline, of 12.9 points, to 33.6 in 3Q23 amid the sluggish global market.
The Trade Value Index, which tracks the movement of unit export prices, dropped by 4.8 points to 44.0 in 3Q23. The downward pressure in export prices was seen across all sectors. Machinery, at 47.5, is seeing the least downward price pressure.
Period | Trade Value Index | Electronics | Clothing | Toys | Jewellery | Timepieces | Machinery |
3Q23 | 44.0 | 44.1 | 41.0 | 42.2 | 43.2 | 36.7 | 47.5 |
2Q23 | 48.8 | 48.3 | 48.8 | 54.4 | 52.5 | 54.2 | 53.8 |
1Q23 | 48.0 | 47.8 | 50.7 | 51.8 | 46.6 | 51.0 | 48.8 |
4Q22 | 39.2 | 39.1 | 34.9 | 37.3 | 39.4 | 44.6 | 44.8 |
Hong Kong exporters continued to run down on inventory. The overall Inventory Index reading was 51.5 in 3Q23 (signalling that exporters are holding slightly less‑than‑normal levels of inventory) versus 48.5 in 2Q23. All sectors except for toys (46.3), reported lower‑than‑normal inventory levels.
Inventory Index by Sector | 3Q23 | 2Q23 |
Electronics | 51.0 | 48.1 |
Clothing | 53.8 | 42.4 |
Toys | 46.3 | 50.0 |
Jewellery | 55.4 | 54.5 |
Timepieces | 62.0 | 52.2 |
Machinery | 55.4 | 56.3 |
Overall | 51.5 | 48.5 |
Note: The Inventory Index, first introduced in the HKTDC Export Index survey 2Q23, tracks the inventory levels held by respondents at the time of the survey being conducted. The index is rated from 0 to 100. An index reading above 50 indicates a lower-than-normal inventory level, while a reading below 50 indicates a higher-than-normal inventory level. | ||
Input‑buying activity remained weak, even though exporters have lower‑than‑normal inventory levels. The Procurement Index decreased slightly in 3Q23, by 4.8 points, to 39.5. Purchasing activity was down across all sectors.
Period | Procurement Index | Electronics | Clothing | Toys | Jewellery | Timepieces | Machinery |
3Q23 | 39.5 | 39.6 | 35.2 | 37.3 | 37.9 | 30.0 | 42.5 |
2Q23 | 44.3 | 44.2 | 45.1 | 47.1 | 44.3 | 45.0 | 46.3 |
1Q23 | 28.4 | 27.8 | 36.1 | 30.3 | 34.6 | 33.3 | 35.2 |
4Q22 | 28.9 | 28.6 | 29.2 | 26.8 | 28.8 | 37.3 | 35.2 |
The Employment Index edged down by 2.2 points to 45.9 in 3Q23. The toys and clothing sectors remained at the same level as in the previous quarter, while other sectors further cut recruitment activities.
Period | Employment Index | Electronics | Clothing | Toys | Jewellery | Timepieces | Machinery |
3Q23 | 45.9 | 45.9 | 45.1 | 48.0 | 44.3 | 39.2 | 46.9 |
2Q23 | 48.1 | 47.9 | 45.1 | 48.0 | 47.9 | 49.2 | 51.9 |
1Q23 | 47.6 | 47.0 | 59.9 | 52.8 | 45.2 | 62.7 | 45.1 |
4Q22 | 40.3 | 40.3 | 38.6 | 37.3 | 38.5 | 43.1 | 44.4 |
The majority of respondents are currently operating at less than full capacity. In the third quarter of 2023, 73% of respondents shared that their capacity utilisation level (which includes manpower and production equipment) was lower than normal.
Economic risks and geopolitical tensions remain the top concerns. The risk of economic slowdowns or recessions in overseas markets (48.6%), geopolitical tensions (17.9%), and a smaller‑than‑expected boost from the mainland's economic recovery (16.5%) were cited as the three major challenges to respondents’ export performance over the next three months.
Biggest Challenge to Export Performance Over the Following Three Months
3Q23 | 2Q23 | ||
Challenge | Share (n=504) | Challenge | Share (n=504) |
Economic slowdown / recession risk in overseas markets | 48.6% | Economic slowdown / recession risk in overseas markets | 66.1% |
On-going geopolitical tensions | 17.9% | Smaller-than-expected boost from mainland economic recovery | 10.9% |
Smaller-than-expected boost from mainland economic recovery | 16.5% | US-China trade friction | 10.7% |
Note: Respondents could select one option only. | |||
Looking towards the year's end, exporters' views on the profitability outlook for their operations were similar to the findings for 2Q23. The majority of respondents (61.7%) expected to see a stable (34.3%) or higher profit margin (27.4%), whereas 38.3% expected to see lower net profit margin.
Exporters intend to adopt pro‑growth business strategies. While increased marketing and promotional activities remained exporters' key strategies in 3Q23 (41.4%), there was a significant rise in exporters who said they plan to provide a wider range of value‑added services (up 19.2 percentage points to 40.5%). Diversifying sales to additional markets and increasing e‑commerce activity were also among the top five strategies identified, although slightly more respondents said cash‑flow management was a key focus (32.0%, up 4.7 percentage points).
Which of the Following Business Strategies Does Your Company Intend to Adopt?
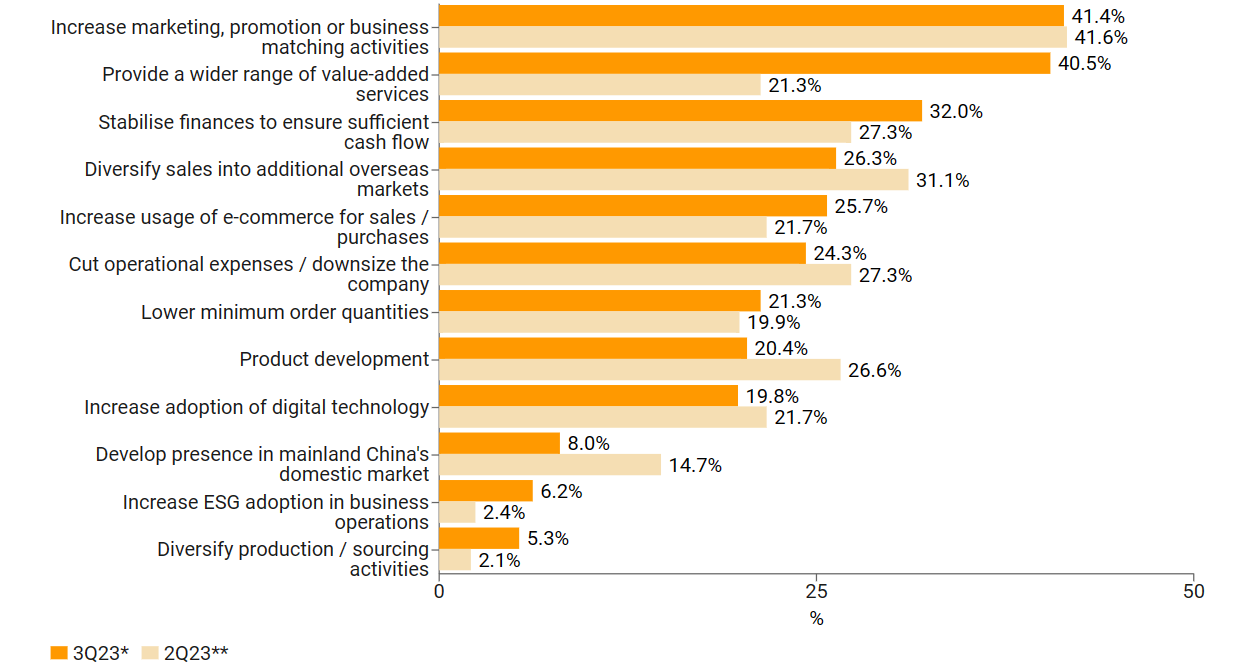
Note: Respondents could select all options that applied.
* Strategies for the rest of 2023, based on 3Q23 survey (Base: Number of respondents with a valid response, n=338)
** Strategies for the 2nd half of 2023, based on 2Q23 survey (Base: Number of respondents with a valid response, n=286)



















First, please LoginComment After ~